Key takeaways
- p50 (the median) is the latency half of your measurements are under: what a typical moment feels like. p95 is the value 95% are under: how bad the slow moments get.
- Averages hide spikes. A handful of very slow moments barely move the average, but they are exactly what freezes a call or loses a game.
- Starlink reports a US median peak-hour latency of 25.7 ms and says fewer than 1% of US measurements exceed 55 ms. That is a p50 and roughly a p99, network-wide, not your house.
- Our report grades gaming on evening p95 latency (OK at 60 ms or less) and uploads on the slowest 10% of tests, because the bad moments matter more than the typical one.
On this page
- The definitions, in plain words
- A worked example you can redo
- Reading p50 and p95 together
- Starlink’s published numbers, read as percentiles
- How the report uses them
- Other percentiles you will see
- Why p95 rather than p99 for one home connection
- Work out your own p50 and p95
- Edge cases
- Common mistakes
- What we don’t know
- What to do next
- Questions people ask
- Sources
p50 is your typical latency and p95 is how bad the slow moments get. If you sort a day’s latency measurements from fastest to slowest, p50 (the median) is the one in the middle, and p95 is the one 95% of the way along: only the slowest 5% are worse. The Work-Day Reliability Report shows both because calls and games are ruined by the slow moments, and an average hides them. A small gap between p50 and p95 means a steady line; a big gap means spikes.
The definitions, in plain words
Latency is how long a packet takes to get somewhere and back, in milliseconds (latency). A logger measures it many times a minute, so a workday produces thousands of numbers. Nobody wants to read thousands of numbers, so we summarize them. The question is which summary.
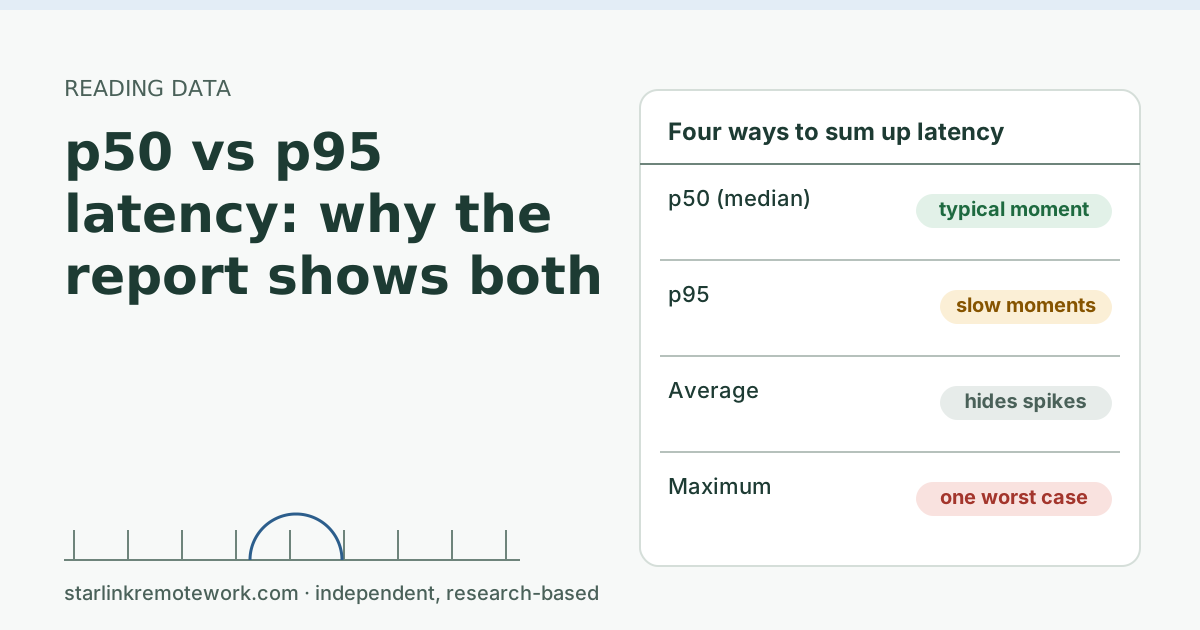
- p50 (median): sort the measurements; take the middle one. Half are faster, half are slower. It answers “what does a normal moment feel like?”
- p95: the value that 95% of measurements are at or below. It answers “how bad do the slow moments get, setting aside the very worst?”
- Average (mean): add them all up and divide. Familiar, but easily misleading for latency.
- Maximum: the single worst measurement. Often a one-off; too jumpy to compare day to day.
Our glossary’s short version: “p50 is the middle value (median); p95 is the value 95% of measurements stay under” (percentile).
Google’s Site Reliability Engineering book makes the case for percentiles: “a high-order percentile, such as the 99th or 99.9th, shows you a plausible worst-case value, while using the 50th percentile (also known as the median) emphasizes the typical case,” and “a simple average can obscure these tail latencies, as well as changes in them.”
A worked example you can redo
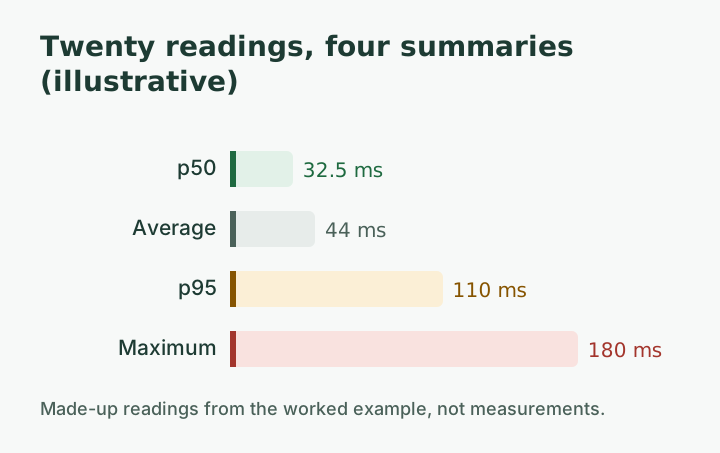
Here are 20 made-up latency readings in milliseconds, already sorted. They imitate a connection that is usually quick with two short spikes:
24 26 27 28 29 30 30 31 31 32 33 34 35 36 38 40 42 45 110 180- p50: with 20 values, the middle sits between the 10th and 11th (32 and 33), so about 32.5 ms.
- p95: 95% of 20 is 19, so p95 is about the 19th value, 110 ms (methods for small samples differ slightly; with thousands of readings they agree).
- Average: the sum is 881, divided by 20 is about 44 ms.
- Maximum: 180 ms.
Look at what each tells you. The average of 44 ms suggests a connection a little slower than typical, all the time. That isn’t what happened: most moments were around 30 ms, and two moments were awful. p50 captures the first fact; p95 captures the second. On a video call, those two spikes are when your voice stuttered. In a game, they are when you rubber-banded.
| Summary | Value in the example | What it tells you |
|---|---|---|
| p50 | about 32.5 ms | Typical moment: quick |
| Average | about 44 ms | A blend that matches no real moment |
| p95 | about 110 ms | Slow moments are much slower |
| Max | 180 ms | One worst moment |
Reading p50 and p95 together
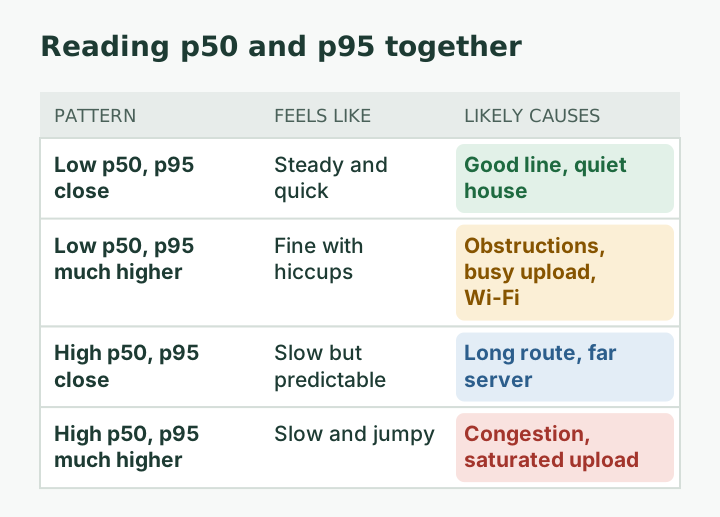
The gap between them is the useful part.
| Pattern | What it feels like | Typical causes |
|---|---|---|
| Low p50, p95 close to it | Steady and quick | Good line, quiet house |
| Low p50, p95 several times higher | Usually fine, with noticeable hiccups | Obstructions, busy upload, Wi-Fi, satellite hand-offs |
| High p50, p95 close to it | Consistently slow but predictable | Long route, far server |
| High p50 and much higher p95 | Slow and jumpy | Congestion, a saturated upload |
For calls, a predictable delay is easier to live with than a jumpy one; the call app’s buffer can smooth steady delay but not spikes. For games, the same is true: you can adapt to a steady 45 ms, but not to a line that jumps to 150 ms during a fight.
Starlink’s published numbers, read as percentiles
Starlink publishes two numbers that map neatly onto this:
- 25.7 ms median peak-hour latency across US customers. That is a p50.
- Fewer than 1% of US latency measurements exceed 55 ms. That is roughly a p99.
Ookla’s Speedtest data puts Starlink’s US median multi-server latency at 39 ms for Q1 2026, measured differently (to test servers, at the moments people run tests). These are network-wide, third-party or company figures, not ours, and they describe millions of connections blended together. Your dish, with your trees and your Wi-Fi, has its own p50 and p95. That is the reason to measure one connection carefully, which is what the report does.
How the report uses them
The report’s grading thresholds, published on the method page, use the slow end on purpose:
- Gaming: graded on evening (6 to 11 pm) p95 latency. OK is 60 ms or less, degraded is 60 to 100 ms, and over 100 ms is graded “would drop.”
- Uploads: graded on the slowest 10% of work-hour upload tests (p10), because “a call needs the floor, not the average.”
- Calls: each work-hour minute counts as call-ready only if latency, jitter and loss all stay within limits, so a spike fails that minute even if the hour’s average looks fine.
When the owner’s logger has a full month, each report page will show p50 and p95 by hour of the workday. Until then there are no measured numbers to show, and we won’t fill the gap with guesses.
Other percentiles you will see
- p10 is the value only 10% of measurements fall below. For latency that is the fast end and rarely interesting. For upload speed it is the slow end, which is why the report grades uploads on p10: the worst tenth of tests decides whether a call stutters.
- p90 is a gentler version of p95, common in app dashboards.
- p99 is the slowest 1%. Starlink’s “fewer than 1% exceed” statement is a p99 claim. It is useful with lots of data, but on one connection over one day it is driven by a handful of readings, so it jumps around.
Why p95 rather than p99 for one home connection
Percentiles near the very edge need a lot of data to be stable. With one reading a second over a ten-hour workday you have 36,000 readings, so the slowest 1% is 360 readings, enough for a stable p99 on that day. But break the day into hourly cells, as the report does, and each hour has 3,600 readings: the slowest 1% is only 36, and a single bad minute can swing it. p95 (180 readings an hour) is steadier, while still capturing the spikes people notice. That trade-off is why the report leads with p50 and p95 and keeps the maximum as context.
Work out your own p50 and p95
You can do this with free tools.
- Log pings for an hour to a stable address. On Windows:
ping -n 3600 1.1.1.1 > ping.txt. On a Mac or Linux:ping -c 3600 1.1.1.1 > ping.txt. That is about one reading a second. - Pull out the times. Open the file in a text editor or spreadsheet and keep only the “time=” numbers. Count lost replies separately; they are packet loss, not latency.
- In a spreadsheet, put the numbers in column A and use
=MEDIAN(A:A)for p50 and=PERCENTILE(A:A,0.95)for p95. Most spreadsheet programs have both functions. - Repeat at different times: during a work call, in the evening, while someone uploads. Compare the p95s, not just the medians.
If your p95 jumps only when someone uploads, you have found a bufferbloat or upload problem, not a satellite problem; see the uploads guide.
Edge cases
- Different targets give different numbers. Latency to a nearby server and to a game server across the country can differ a lot. Compare p95s measured to the same target.
- Lost packets aren’t in the latency numbers. A reading that never came back has no latency. A connection can show a fine p95 and still drop calls through loss; that is why the report tracks loss separately.
Common mistakes
- Comparing one person’s average with another’s median. Use the same summary on both sides.
- Reading p95 from a short test. A 30-second speed test has too few samples for a meaningful p95. You need many minutes, ideally days.
- Ignoring time of day. Evening p95 and morning p95 can differ. That is why the report breaks results down by hour.
- Treating the maximum as typical. One 900 ms spike in a day is noise; a p95 of 150 ms is a pattern.
What we don’t know
The worked example is invented to show the arithmetic. We don’t yet have a measured p50 or p95 for the owner’s connection; the report will publish them once a month of workdays is logged. Starlink’s and Ookla’s figures are measured in their own ways, and we can’t check their methods beyond what they publish.
What to do next
- See how short spikes become frozen calls in why Zoom freezes, then catches up and what Teams’ poor-network warning reacts to.
- Read the honest gaming verdict, which leans on p95, in is Starlink good for gaming.
- Check back on the Work-Day Reliability Report for the first logged month.
Questions people ask
What does p95 latency mean?
It is the latency value that 95% of measurements are at or below. Only the slowest 5% are higher. It describes how bad the slow moments get, which an average hides.
What is the difference between p50 and p95?
p50, the median, is the middle value: half of measurements are faster, half slower. p95 is near the slow end. A small gap between them means a steady connection; a big gap means frequent spikes.
Why not just use average latency?
Because a few very slow moments hardly change the average, even though they are what people notice. Google’s SRE book makes the same point: a simple average can obscure tail latencies and changes in them.
What is a good p95 latency for video calls?
Microsoft’s connectivity test passes Teams when latency is under 100 ms, so a p95 comfortably below that leaves room. Jitter and packet loss matter as much as latency for calls.
What is a good p95 latency for gaming?
Our report calls evening p95 latency of 60 ms or less OK and 60 to 100 ms degraded. Competitive shooters want lower than any satellite link gives.
Is Starlink’s latency consistent?
Starlink says its US median peak-hour latency is 25.7 ms and fewer than 1% of measurements exceed 55 ms. Individual connections vary, especially with obstructions, which is why one connection’s p95 is worth measuring.
Sources
- Starlink network update (starlink.com/updates/network-update; text read from page bundle), checked Oct 5, 2026
- Ookla: Starlink Hits New Highs in the U.S. (published 2026-05-05, modified 2026-06-23) (secondary), checked Oct 5, 2026
- Microsoft Learn – Microsoft 365 network connectivity test tool, checked Oct 5, 2026
- Google SRE book: Service Level Objectives (percentiles vs averages), retrieved Oct 6, 2026
Research-based: written from vendor documentation, Starlink support pages and standards, not from our own measurements. Starlink rules and prices on this page come from our dated fact file and show the day they were checked; they change, so confirm before you rely on one.Links to Starlink’s plan pages here use the site owner’s own referral link; the owner may get a referral reward and your price is the same. No affiliate links (how we make money). General information, not professional IT, legal or medical advice. Independent · not affiliated with SpaceX or Starlink. Spotted an error? Tell us.