Network changes affecting latencyBackground
Ookla’s report lists US Starlink median multi-server latency of 39 ms in Q1 2026
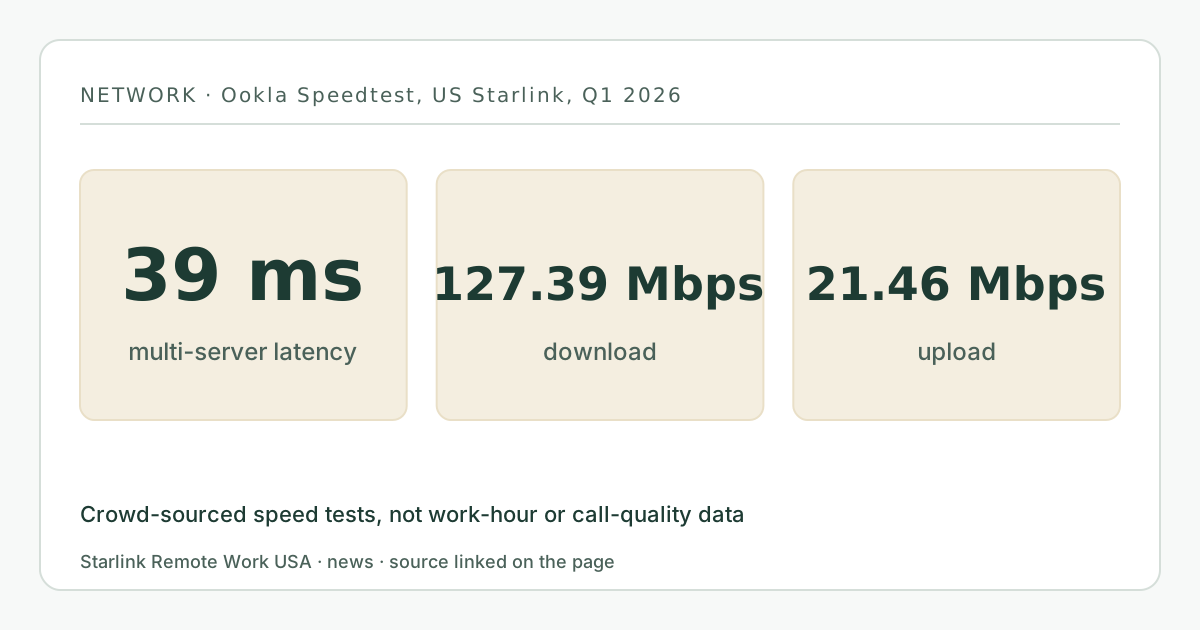
An Ookla report published May 5, 2026 says US Starlink Speedtest users had a median multi-server latency of 39 ms in Q1 2026, with median downloads of 127.39 Mbps and uploads of 21.46 Mbps. It also says 10 states had a median under 40 ms in the second half of 2025, up from one state a year earlier. These are crowd-sourced speed test medians, not call-quality or work-hour measurements. Published October 6, 2026.
- Event date
- Published here
- Updated
- Source
- Ookla
Background itemThis happened 154 days before we published it (more than 90). It is here as context for the guides it links, not as breaking news. Check the source for anything that has changed since.
What changed
On May 5, 2026, Ookla published a report on Starlink’s US performance based on its Speedtest data. The figures for Q1 2026:
- Median multi-server latency: 39 ms. In Ookla’s words, “Starlink has a latency of just 39 ms as of Q1 2026.”
- Median download: 127.39 Mbps.
- Median upload: 21.46 Mbps.
The report also looks back at 2025:
- In the second half of 2025, 10 states had a Starlink median multi-server latency under 40 ms, up from one state (New Jersey) in the second half of 2024.
- Starlink’s median multi-server latency improved in all but three states (Hawaii, New Mexico and Oregon).
- In Q4 2025, 44.7% of Starlink Speedtest users got at least 100 Mbps down and 20 Mbps up, the FCC’s broadband benchmark, up from 17.4% in Q1 2025.
When
- Published: May 5, 2026.
- Periods covered: the second half of 2024 through Q1 2026.
Who is affected and what it means for you
This is the largest independent snapshot of US Starlink performance we’ve seen for early 2026, and it points the same way as Starlink’s own figures: latency down, speeds up.
Two things to keep in mind when you read it:
- It’s a different measurement from Starlink’s. Starlink’s 25.7 ms is a company figure for peak hours. Ookla’s 39 ms is a “multi-server” latency from user-run speed tests, which includes the path to several test servers. Neither is wrong; they measure different things, so don’t subtract one from the other.
- Speed tests aren’t work days. A speed test runs for a few seconds when someone chooses to run it. It doesn’t capture a two-second drop in the middle of a call at 2 p.m. on a Tuesday, which is what our Work-Day Reliability Report is designed to show for one connection.
The upload figure is the one to watch for work. A median of 21.46 Mbps is plenty for one video call, but two people on calls while someone else uploads photos can still saturate it.
What you can do now
- Run your own tests at the times you work, not just once in the evening.
- Look at upload as well as latency. If your upload during calls is far below the median, check obstructions, Wi-Fi and other uploads in the house.
- Gamers: a 39 ms median is fine for most games; our gaming verdict explains why fast shooters still feel the variation.
- Our report method page explains how the owner’s logger measures latency every minute, and how you can run the same logger.
What stays the same
- Plans, prices, CGNAT and IP policy are unaffected.
- Speed-by-state comparisons are outside what this site covers; we only report the national latency figures here.
What we don’t know yet
- How the Q2 and Q3 2026 figures compare; Ookla hadn’t published them in a report we read.
- How much of the improvement comes from network changes versus changes in who runs speed tests.
This item is background: it was published more than 90 days before this page.
Source
Related guides on this site
Correction log
No corrections since publication. Spotted an error? See corrections for how to tell us; changes are logged here with the date.